
Dashboard guide
See where customer service needs attention
Review conversation volume, analysed outcomes and handling patterns before deciding what to improve next.

Short answer
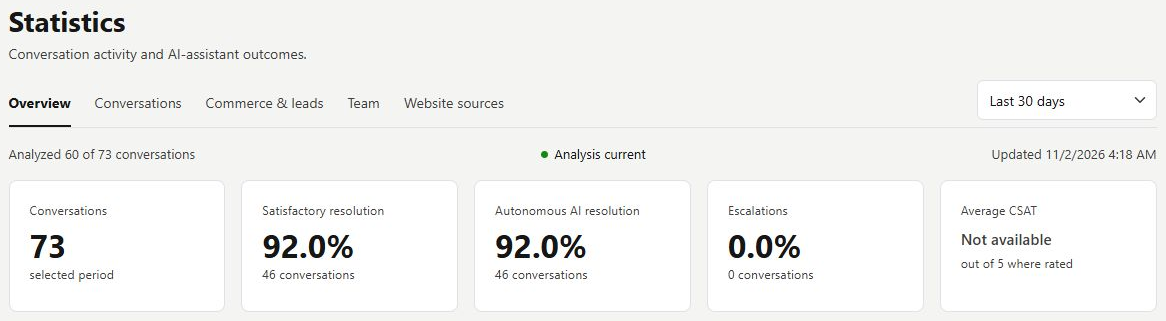
The statistics overview brings customer conversation volume and analysed outcomes into one report. Choose a period, check how many conversations have been analysed and read the handling charts alongside the totals. Use the report to find a question worth investigating, then open the relevant conversations. An inferred outcome is different from a customer-submitted satisfaction score.
Read the coverage before the percentage
Open Statistics > Overview and choose the reporting period. The coverage line shows how many conversations have been analysed and when the report was updated. Conversation totals and classified outcomes can therefore have different denominators. Read satisfactory resolution, autonomous resolution, escalations and CSAT according to their own labels.
Find the pattern, then inspect the enquiry
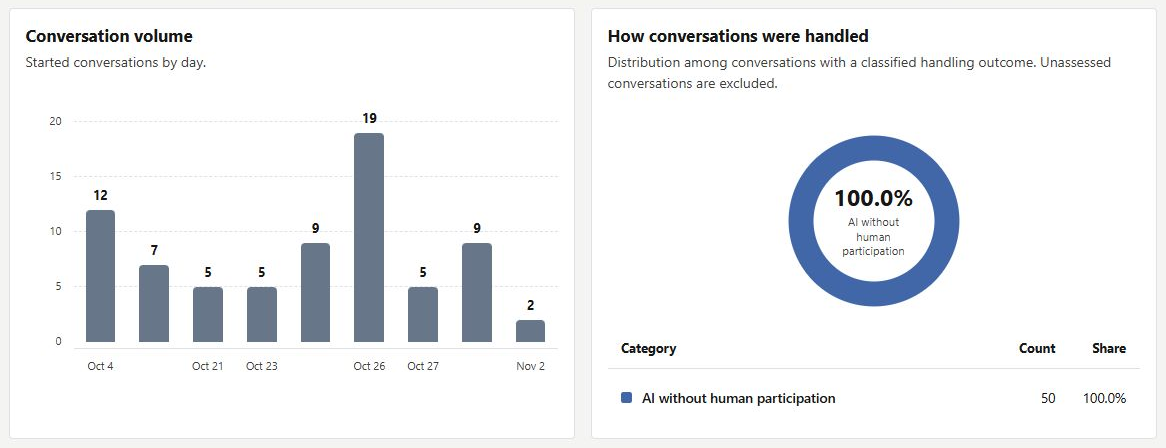
Compare daily conversation volume with the handling distribution. A busy day and a high AI-handling share answer different questions. Use the Conversations, Commerce & leads, Team and Website sources reports for a more focused view, then read the underlying customer context before deciding what to change.
- The screenshots are one workspace's example report, not a promised result.
- An unavailable customer score should remain unavailable rather than be treated as zero.
What you can do
Use the visible controls to review the setup and choose the next step.
- Choose a reporting period.
- Check analysis coverage and update time.
- Compare conversation volume and handling distribution.
- Continue into focused reports and the inbox.
Continue with the Dashboard guides or your inbox.
Good to know
It is an analysed conversation outcome. CSAT is a separate customer-feedback measure and can be unavailable.
Before you begin
Open the intended workspace and review the current state.
- Check the active workspace and your access.
- Review the relevant information and available controls.
- Verify the result after making an intended change.